
This is the second article about my project to define and optimise the wash production process at a new craft distillery. The first post, covering the differences between beer wort and whisky wash, can be found here.
Why was a new process control method required?
Neither myself not my client had experience of brewing whisky wash at commercial scale, and whilst I had prepared myself by an extensive period of reading and discussions what I found myself with was a fundamental understanding of the biochemistry and a broad-brush overview of the method. What I was missing was practical running details. For example, how to determine the end point of the sparge to consistently yield a wash with the desired gravity (1063). Because a high proportion of strong worts are run off before the sparge (second water) and the temperature of the second water means further sugar formation occurs during the sparge, the reliable calculations one would use for beer wort brewing were not likely to hold. Additionally, because the wort was run off directly into fermenters (FV’s) which did not have the facility for recirculation, it was not easy to get a representative sample of the wash to know it’s gravity either.
What did I devise?
We used the underback as a measuring vessel so that a known number of known volume portions of either strong or weak worts could be run off. Samples of each portion were taken, for the weak worts this was done at the end of each portion and the SG of the portion estimated as the average value between pairs of samples (end of portion N-1 and end of portion N). Since this wort was hot and time was limited, each SG was determined using the density and temperature at point of analysis and a brewing app. algorithm was used to calculate the SG.
I built a spreadsheet to work out the weighted average SG of the combined portions, and during the first few runs we manually mixed the FV and compared the calculated SG to the measured value and found them to be in excellent agreement. This was great news because fully mixing the FV with a hand paddle was hard work.
Once we had three runs worth of data it was clear that this approach was working well. Each complete batch of wash hit the target SG +/- 1 gravity unit. Because we were recording all these data, it was possible to build up a picture of the final SG value of the weak worts run off which would yield the desired 1063 gravity wash.
Now we could go on to optimise the initial mash temperature. With this done, we introduced third water*, which boosted the yield to sugar by a further 7-10%. Once the process conditions were stable it was possible to see that the SG at the desired end point of the sparge (second water) was a consistent value. What I did not expect was that the end point of a fresh water mash and third water mash batch would be the same, but this is what our data showed.
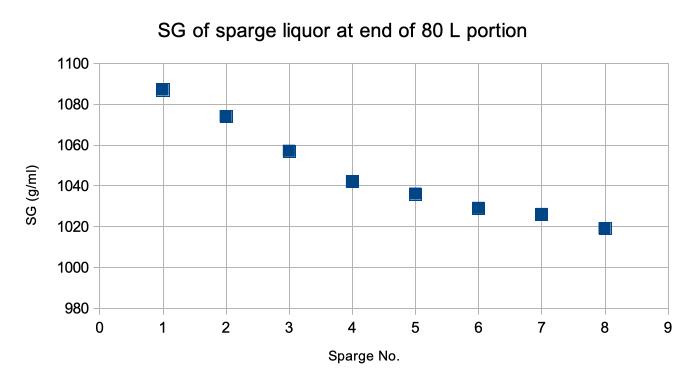
Now we had defined a quick ‘on the hoof’ SG measurement of suitable accuracy and an end point gravity to stop the sparge. No longer did we need to take and analysis lots of samples or use a spreadsheet to calculate our final wash gravity. From the data it was possible to plot an SG vs. sparge volume curve. Because we are running a manually controlled process, with a natural product as our raw material, variations in yield from batch to batch are to be expected. As we moved from the commissioning into production stage we had the understanding to be able to grossly simplified the control philosophy:
1. Check the SG of the strong worts was within the expected range
2. Sparge with a known volume just below the lowest volume we had observed to be required.
3. Check the gravity of the weak worts and compare to the sparge / SG curve and from this estimate how much more sparge water would be required.
4. As we got very close to this volume we could check the weak wort SG vs our desired end point, and stop when we reached this.
5. Seal off the FV and prepare for the collection of third water.*
How well did this work?
We now see wash batches within +/- 2 gravity unit of target each time.
The yield to sugar is > 95% for fresh water batches
The yield to sugar for third water batches is 98-110% (counting the input as just the fresh malt)
My contacts in the distilling industry informed me that a brewhouse yield (yield from malt potential to sugar) should be expected to be > 95% so we were very happy with the above results. It was then time to introduce some minor mechanical changes to the plant to reduce the process time. As I explained in the first post it is important to transfer and cool the hot wash quickly to preserve the limit-dextrinase. At the start of my input we ran a forced fermentation test which showed that it was the wort composition which was the reason the early fermentations were not running to completion. Thus, during this initial phase we were, at my advice, adding an exogenous enzyme to the FV to ensure full fermentation to a gravity of 996-1000. The mechanical changes which I implemented, speeding up the wort transfer, are the subject of my next article.
What now?
Would you like someone to help you optimise or start the operation of a new whisky / grain spirit / beer brewing process? If you are based in the North of England I’d be delighted to come and meet you to see if I can add value. Give me a call.
*Third water is an extra hot sparge (85-89 C) to recover any residual sugars from the spent grist. This in turn is used as the mash liquor for the following batch. For more details of this, see my first post.

Pingback: Maximizing Whisky Yield: Part 3 – improvements to the brewing equipment – small changes can make a big difference. | Hop Doctor